Visualization
CogDB includes built-in graph visualization tools so you can inspect your network visually.
Quick Visualization with show()
The simplest way to visualize a traversal is by chaining the show() method to your query.
from cog.torque import Graph
g = Graph("people")
g.put("alice", "follows", "bob")
g.put("bob", "follows", "fred")
g.put("fred", "follows", "greg")
g.put("greg", "follows", "emily")
g.put("greg", "follows", "dave")
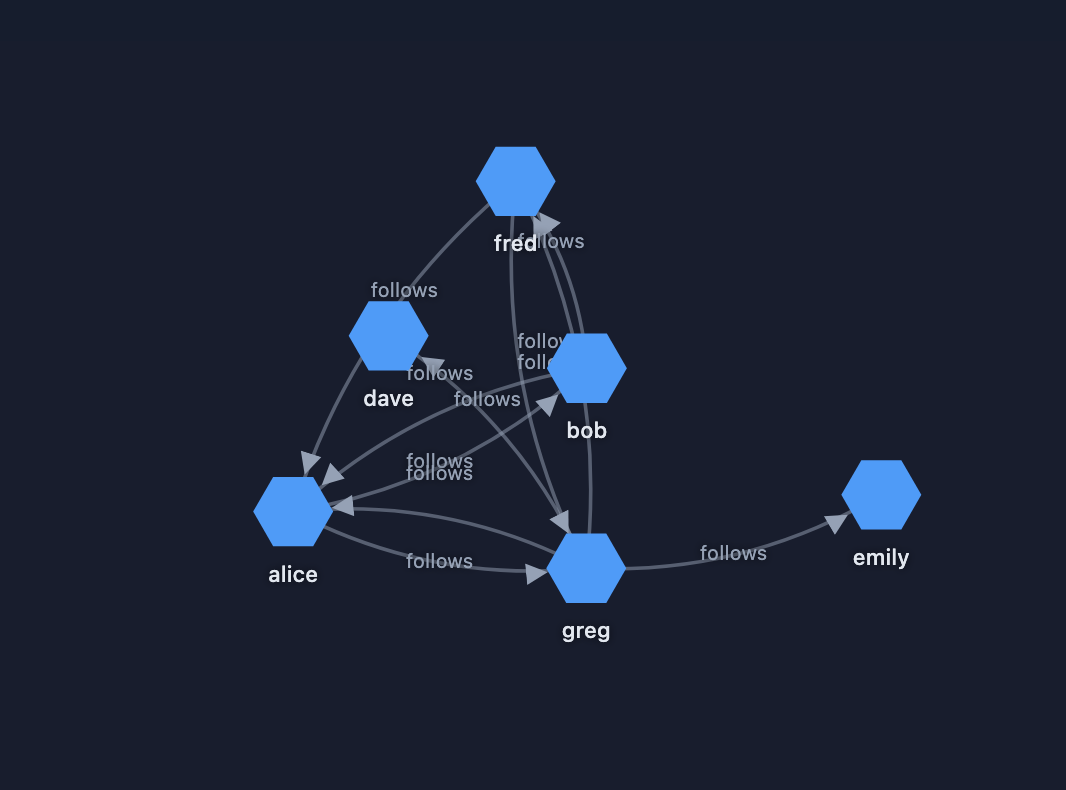
g.v().out("follows").show()
In a Jupyter or Colab notebook, it renders the graph directly inline without saving any file to disk. If you are running a script from the terminal, it will open the interactive graph in your default web browser!
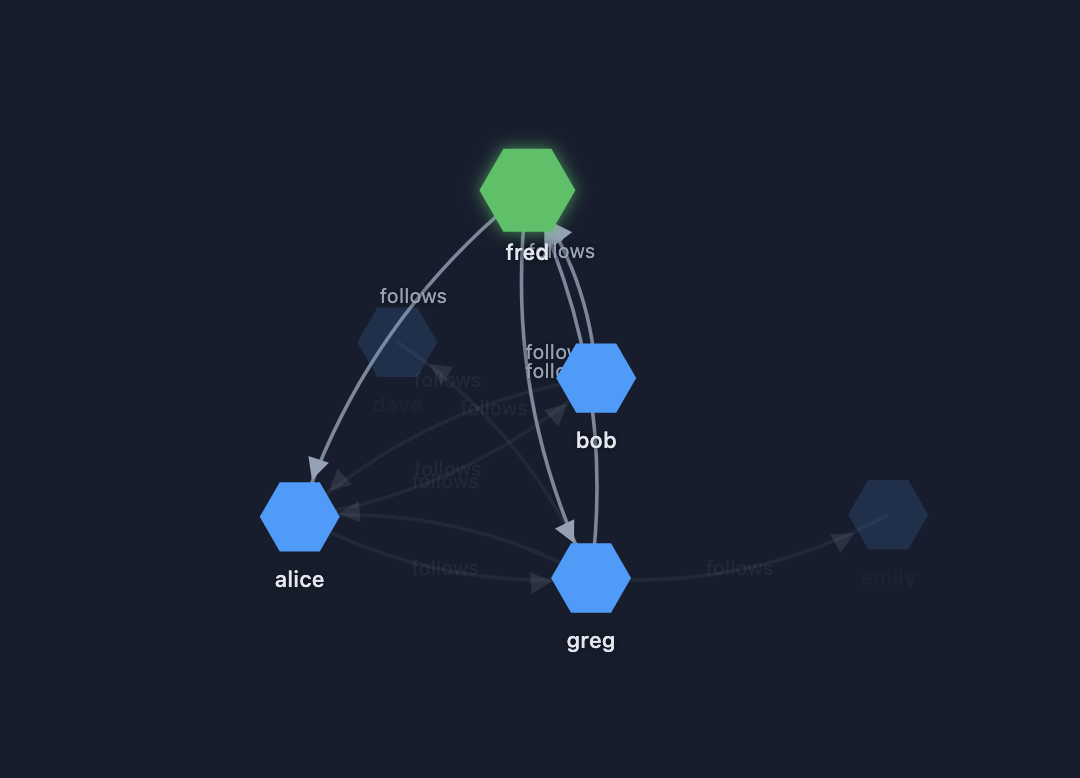
Interactive Exploration
You can seamlessly interact with the graph. For example, clicking on a node like "fred" will highlight its specific connections, allowing you to easily understand network topology and debug relationships.